Asset Hierarchy and Data Structures
Objective: Gain an understanding of the Asset Hierarchy and be able to easily populate and manage assets.
Outcomes: Learn how to structure assets in a hierarchical approach.
Brightly Assetic is designed and is regularly updated in accordance with ISO, International Infrastructure Management Manual (IIMM) and a range of other key industry standards.
Brightly Assetic provides a pre-configured Asset Register Structure and library that enables you to quickly start populating and managing your assets.
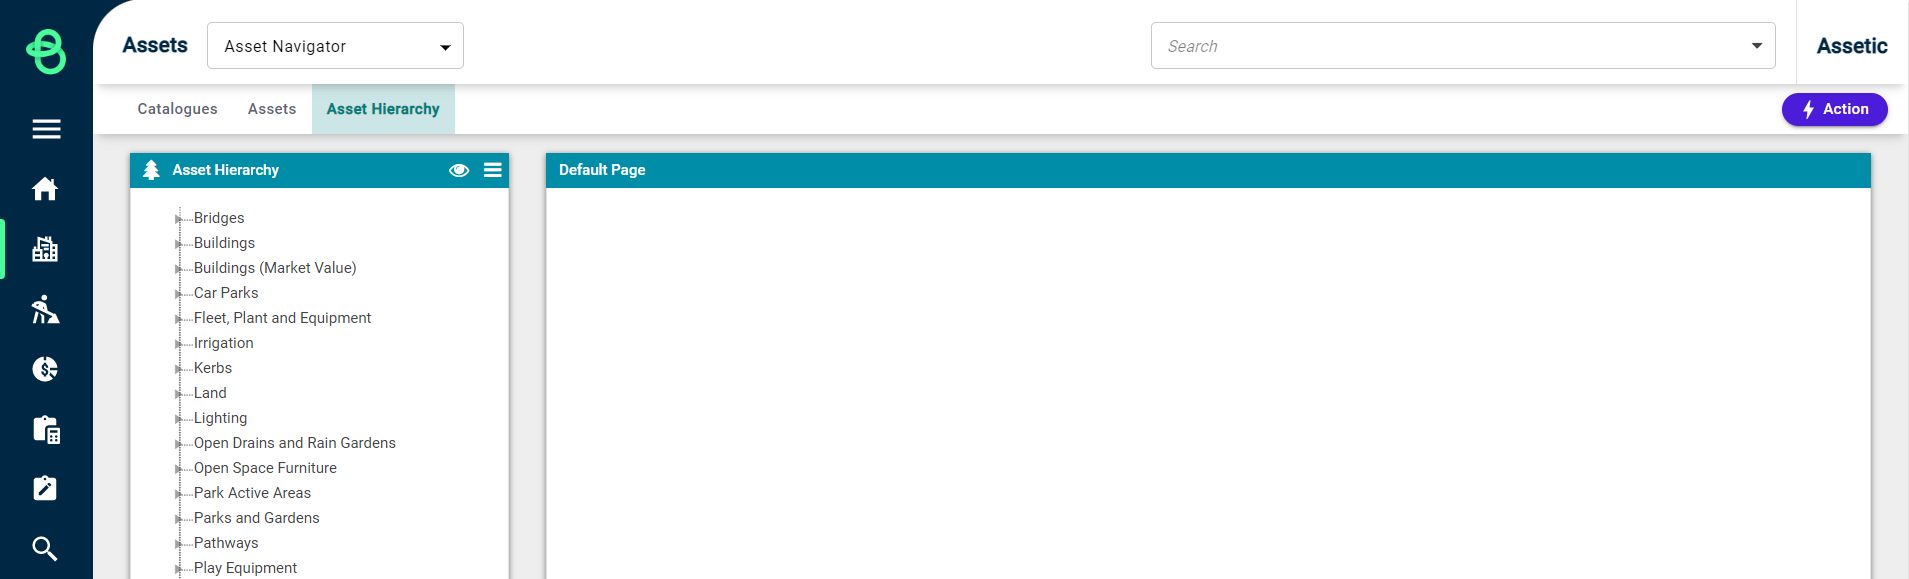
Asset Hierarchy
Allows a user to view Assets in user defined hierarchy. A user can construct hierarchy using a Search profile.
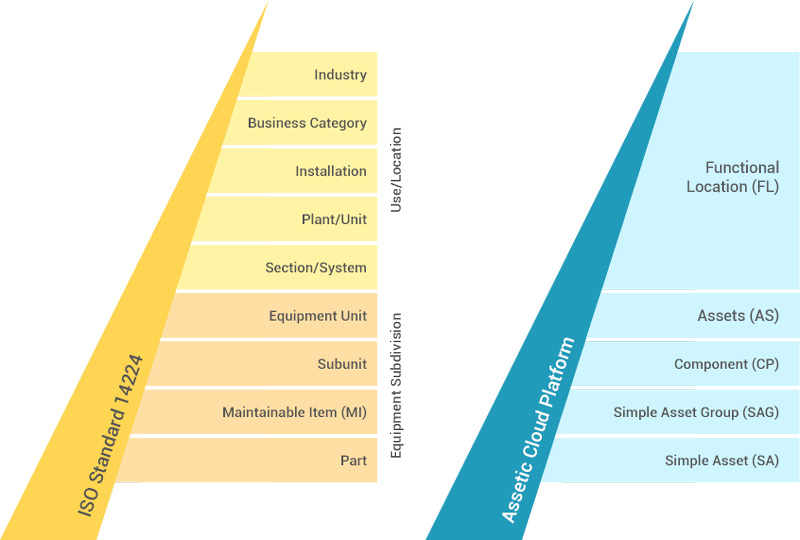
The diagram below sets out an example of how an asset-based hierarchy is configured within Assetic.
|
Name
|
Description
|
|---|---|
| Functional Location(FL) |
Level at which assets can be grouped and can perform high level reporting based on site/grouping asset attributes. |
| Asset (AS) |
An asset you maintain, value (if utilizing historical cost method) and locate which will have fixed components assigned to it. |
| Component (CP) | Components of an asset (AS) allows you to record dimensions, service criteria and value (if using fair value method), and perform accounting transactions. |
| Simple Asset Group (SAG) | Alternative and optional hierarchy which allows the user to group simple assets and perform high level reporting. Simple Asset Groups are only available in certain asset categories (e.g. buildings) to avoid confusion in setup and implementation of asset hierarchies. |
| Simple Asset (SA) | A simple and low level asset against which data can be captured. Allows agencies to collect granular data that they use for internal purposes (e.g. determining facility maintenance activities / coming up with a fit-out value / capturing fine grained engineering data). A Simple Asset gets stored against a Component, and optionally also against a Simple Asset Group. |
Asset Hierarchy and Features Mapping
The following table sets out key features in Assetic and how these relate to the asset hierarchy.
A tick represents this is a core function for the level of asset hierarchy. An "o" represents that attributes (or rolled-up data from lower levels) is utilized. A cross means the function is not available.
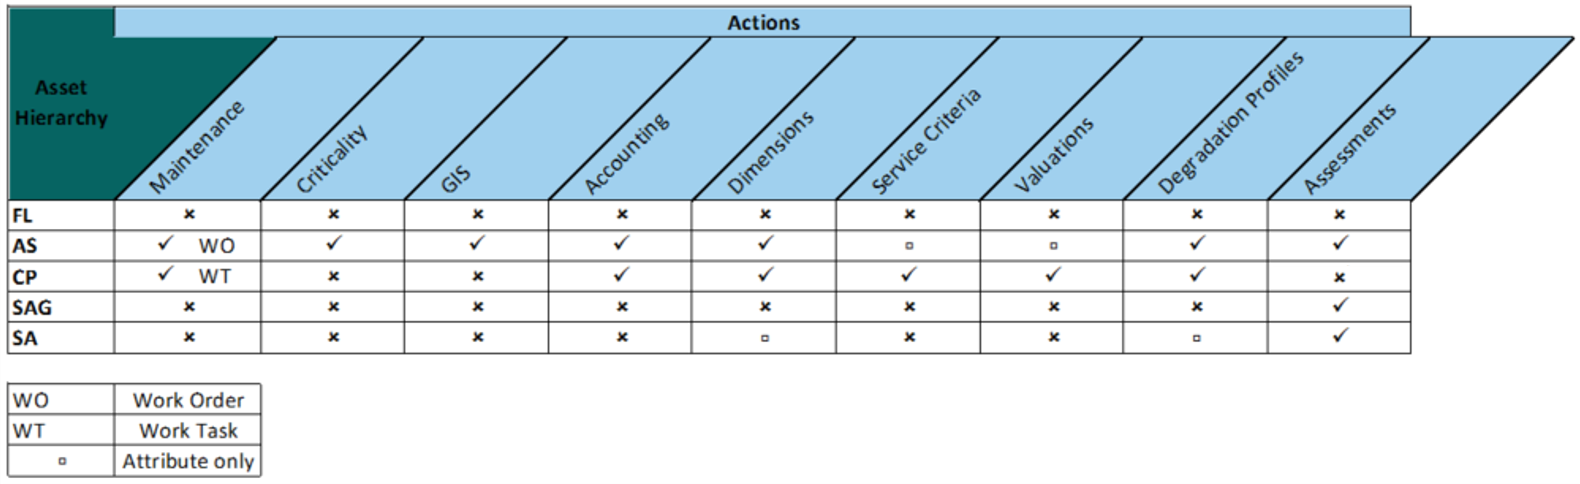
Note: Advanced Search reporting enables data to be rolled up to higher levels in the hierarchy. E.g. I can see the value of a Functional Location (FL) based on the valuation of all Components stored against all Assets sitting underneath the FL.
